The pivot graph found on the Compliance Dashboard is a tool designed to give you a high-level overview of your company's compliance health, broken down by Region and Location. This guide explains how to navigate the graph, define the data categories, and understand exactly how your compliance percentages are calculated.
Table of Contents
Adding the Pivot Graph to Your Compliance Dashboard
Navigating the Pivot Graph
Understanding the Data Categories
How the Compliance Percentage is Calculated
Adding the Pivot Graph to Your Compliance Dashboard
If you do not currently have the pivot graph on your Compliance Dashboard, you can add it using the steps below.
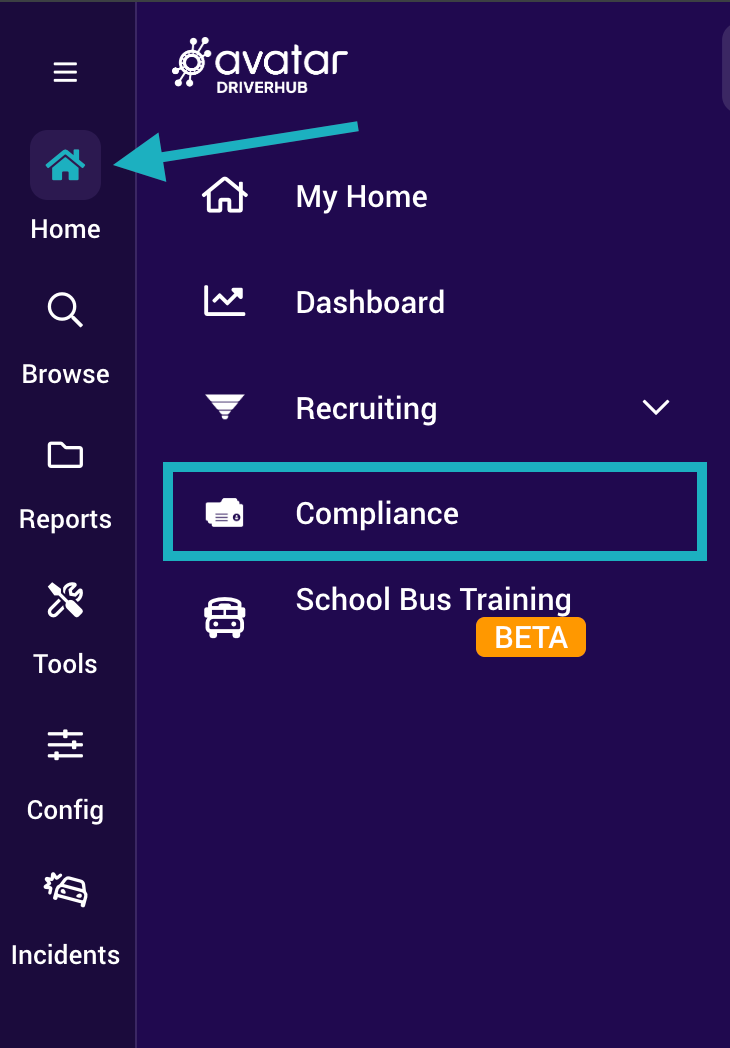
- Open your Compliance Dashboard by navigating to Home > Compliance.
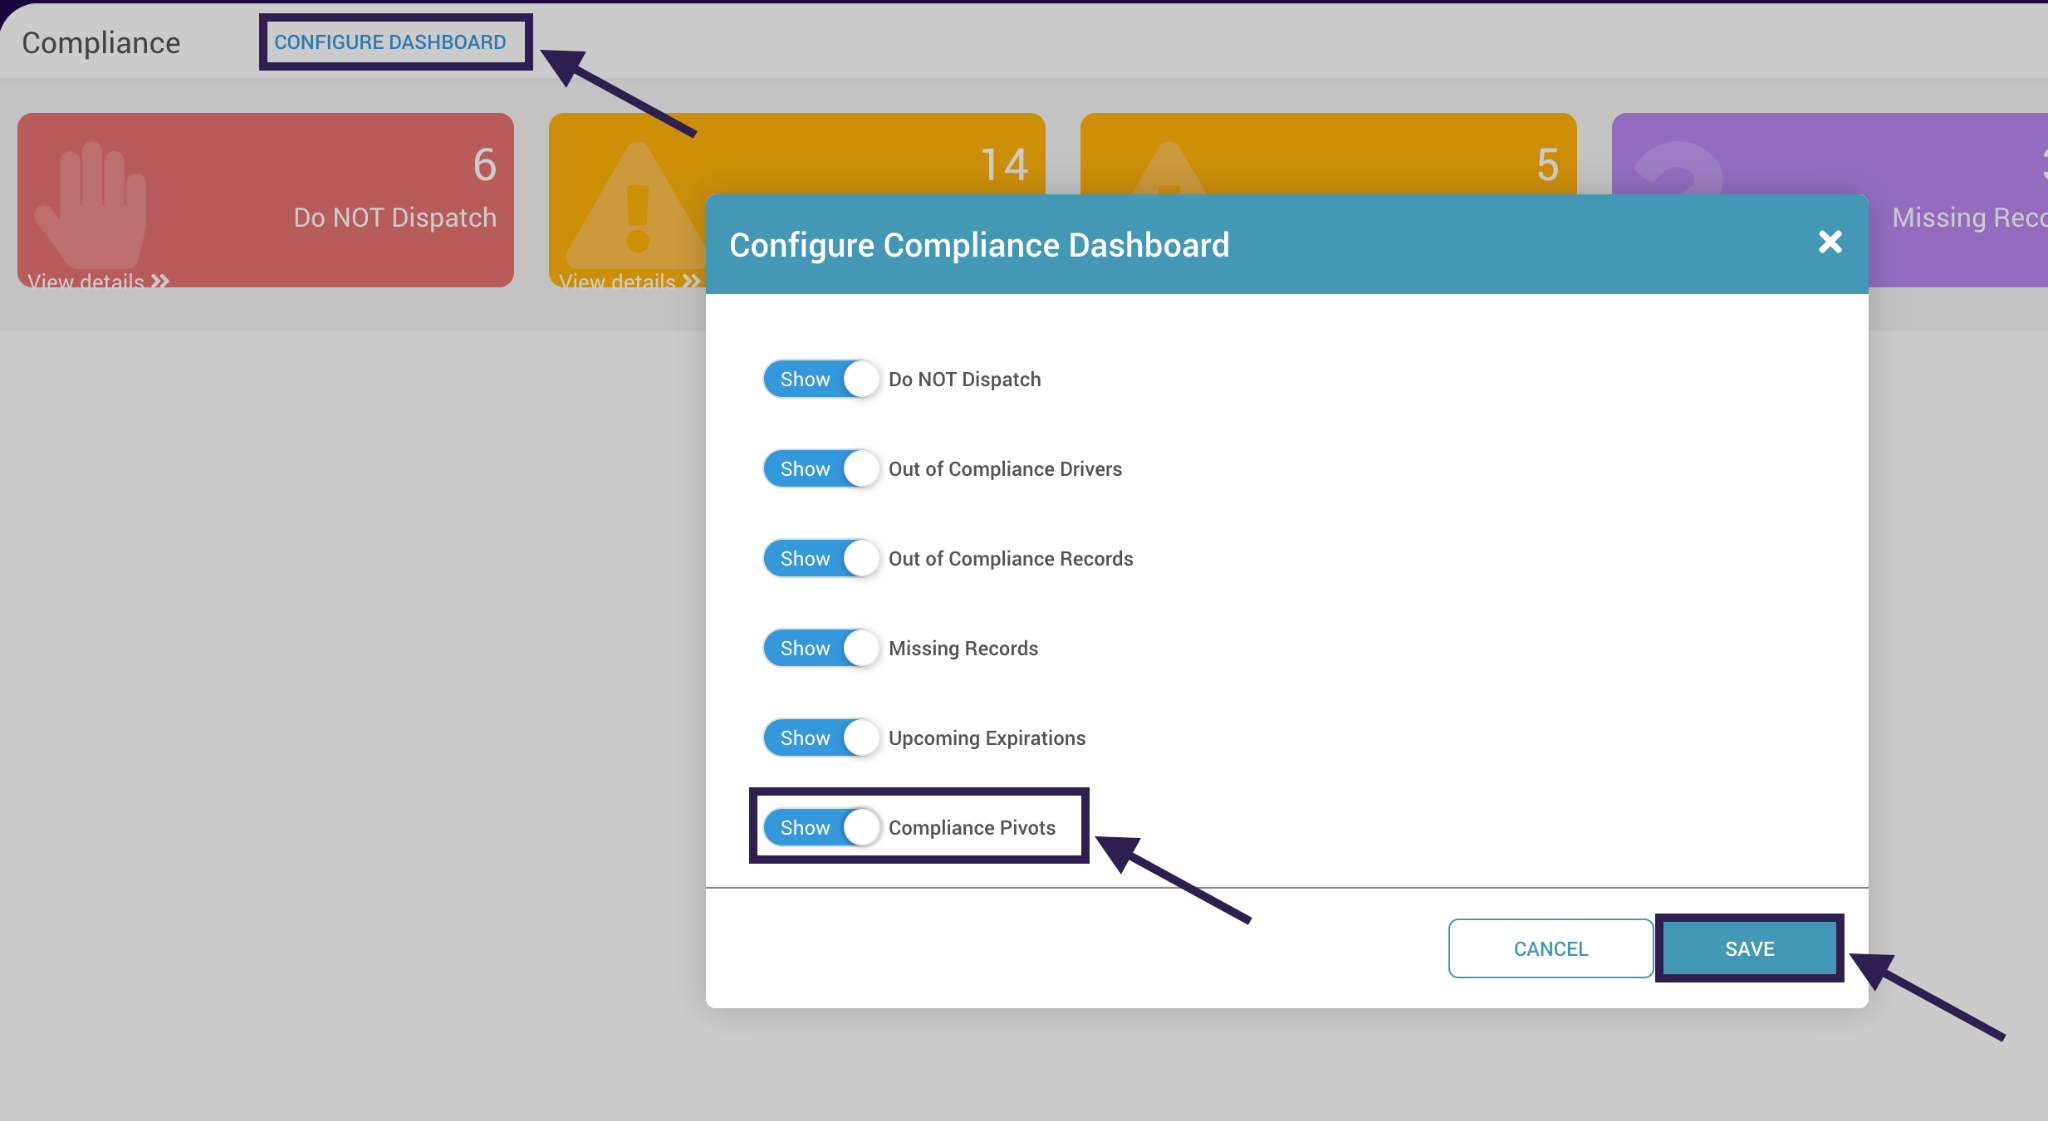
- At the top left of the Compliance Dashboard, click on Configure Dashboard. This will open a series of toggles that let you determine what shows up on your dashboard. Toggle Compliance Pivots to ON, then click Save.
- Your dashboard will automatically refresh to include the pivot graph.
Navigating the Pivot Graph
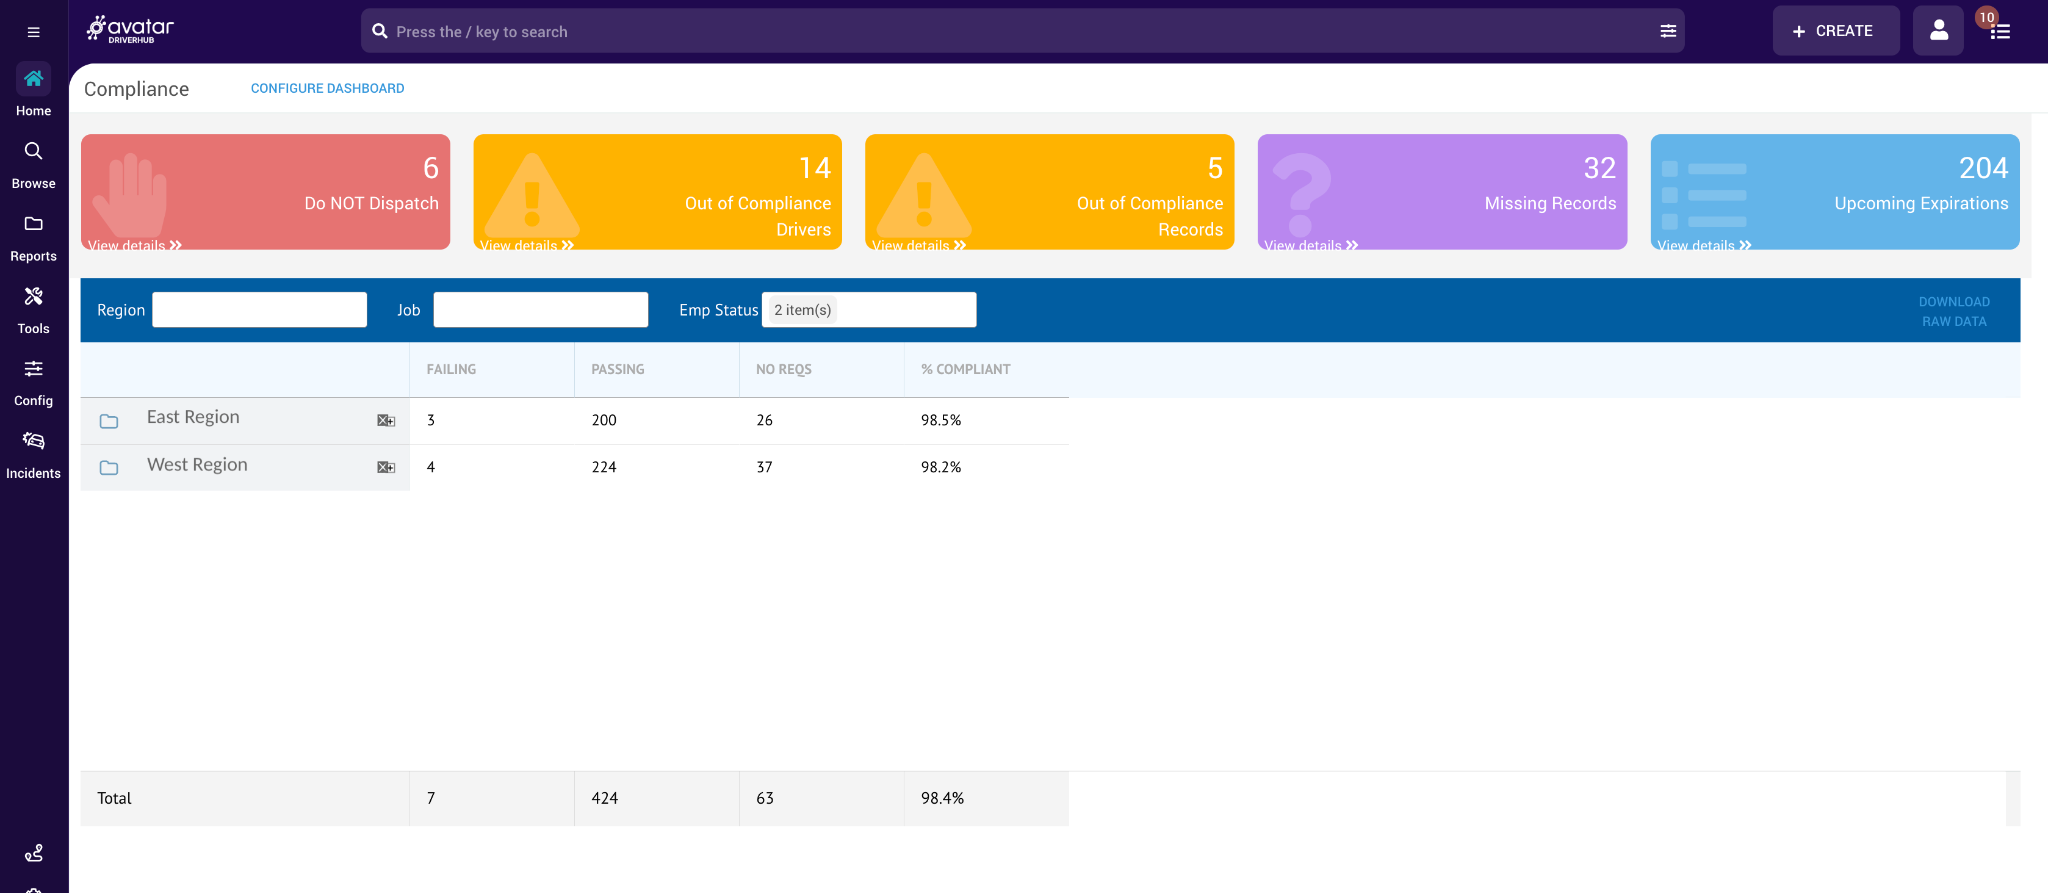
The pivot graph organizes data hierarchically to help you identify specific problem areas.
- View by Region: The top-level view displays compliance data grouped by Region.
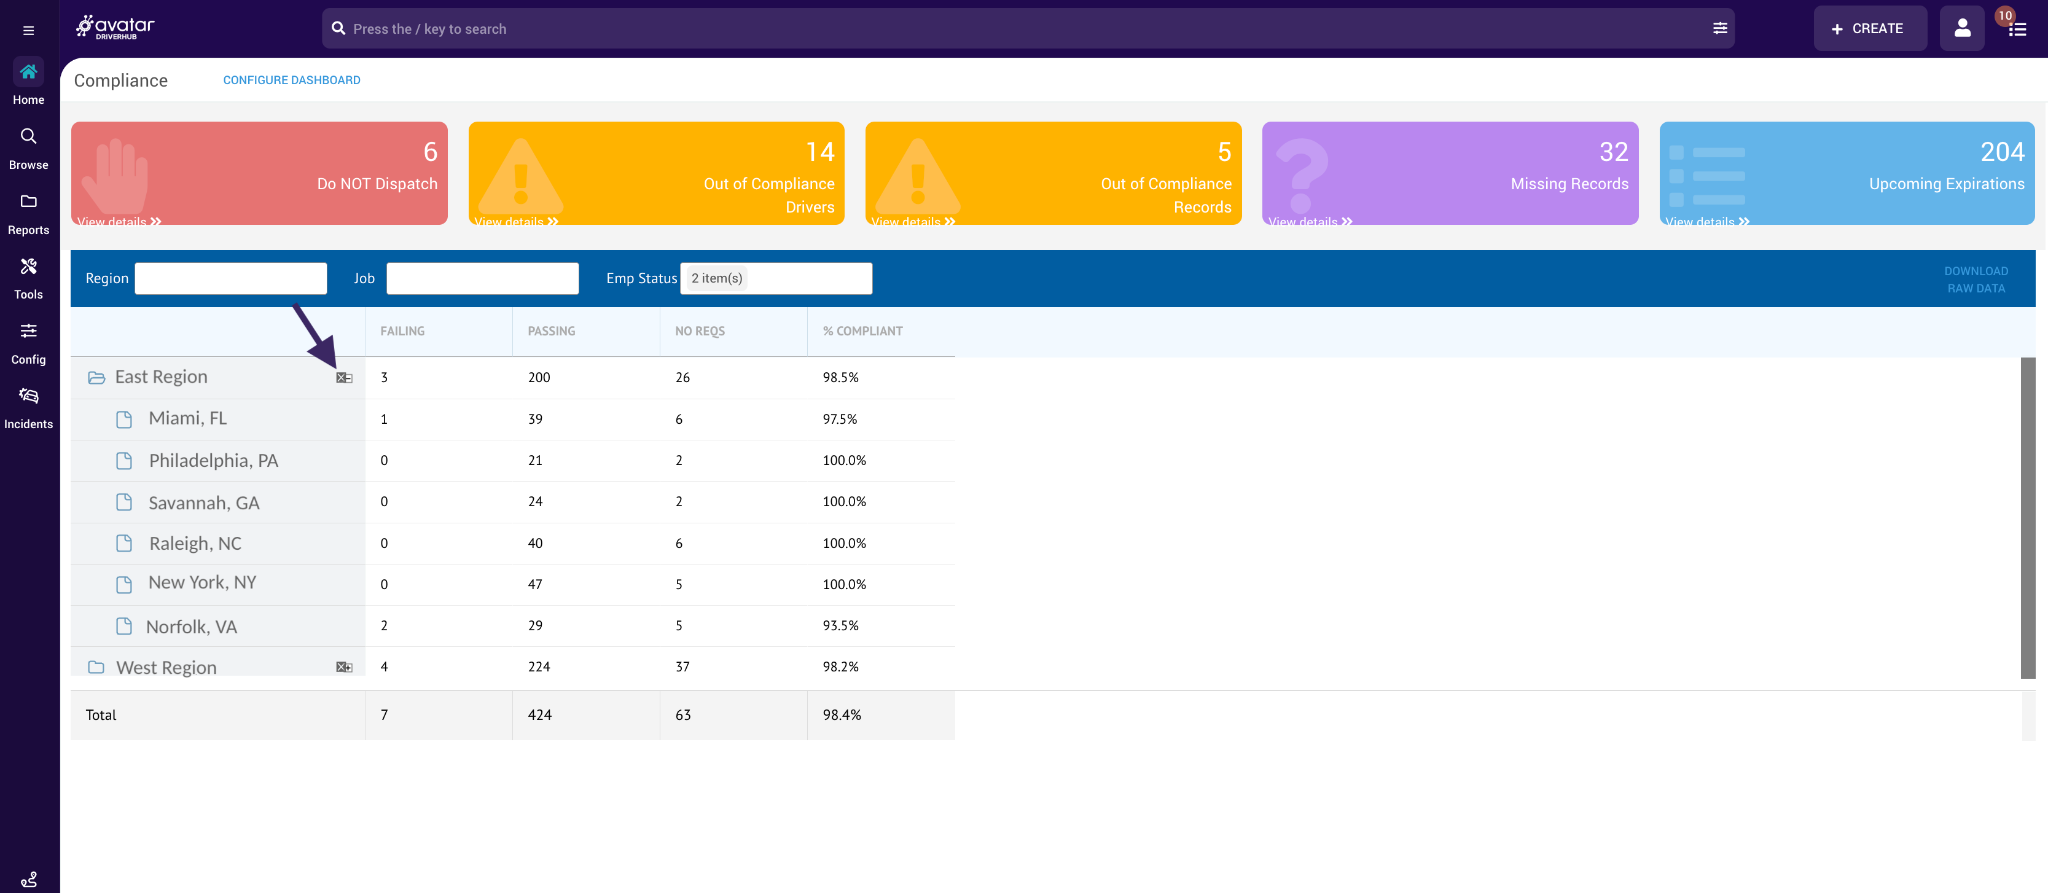
- View by Location: Click the plus sign (+) to the right of a region. This expands the list to show specific data for individual Locations within that region.
Understanding the Data Categories
For every Region or Location, you will see four columns representing your employees. Here is how they are defined:
- Failing: The count of employees who are failing at least one of their assigned compliance rules.
- Passing: The count of employees who are passing all of their assigned compliance rules.
- No Reqs: The count of employees who currently have no compliance rules applied to them.
- % Compliant: The percentage of employees who are passing all of their compliance rules.
Note: The total of these three numbers represents the total headcount for that location based on the selected filters. By default, the pivot graph only includes Full Time and Part Time statuses, but this can be adjusted to include more or less statuses.
How the Compliance Percentage is Calculated
It is important to note that employees with No Requirements are excluded from the compliance score calculation. The percentage reflects only those team members who have active requirements.
The formula used to determine the percentage is:

Calculation Example
Let's look at an example using the following data:
- Passing: 167 employees
- Failing: 45 employees
- No Requirements: 29 employees
To get the score, we ignore the 29 employees with no requirements. We calculate the total number of employees with requirements.
167 + 45 = 212
167 ÷ 212 = 0.7877
0.7877 x 100 = 78.77
This results in a rounded-up compliance score of 78.8%.